7/34

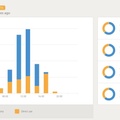
This graph shows were the current was sourced from to power devices in the house. Early morning shows the batteries were still powering everything until just before 08:00 when the sun was strong enough for solar to start powering everything directly. In the early evening as the sun went down, the batteries started outputting power again.
- Copyright
- Creative Commons (BY-NC-SA)
- Created on
- Saturday 1 October 2016
- Posted on
- Saturday 1 October 2016
- Dimensions
- 995*544
- File
- flickr-29756281190.jpg
- File size
- 60 KB
- Keywords
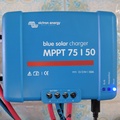
- greenenergy, greentech, MTTP 75/50, Solar, Solar Charge Controller, Victron Energy
- Visits
- 2012
- Rating score
- no rating
- Rate this photo
0 comments
Add a comment