342/8140
.")
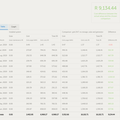
It shows firstly the total amount generated per month, and then breakdown of how much power from solar went where. Charts at bottom show the annual usage which contrasts with the last month (which was Winter).

- Copyright
- Creative Commons (BY-NC-SA)
- Created on
- Tuesday 26 May 2020
- Posted on
- Friday 17 July 2020
- Dimensions
- 1000*725
- File
- Solar System Consumption 1 Yr.png
- File size
- 136 KB
- Visits
- 1240
- Rating score
- no rating
- Rate this photo
0 comments
Add a comment